

The average Central Bedfordshire home was worth £358,558 in September, the highest on record but only 0.7% up on a year ago. Flats are still falling.
The average home in Central Bedfordshire was worth £358,558 in September 2026. That is the highest figure the UK House Price Index has ever recorded for the district.
The previous high was £357,884, in March 2026. September’s average is £979 above August’s, a rise of 0.3% in a month.
The record comes with very slow growth. Over the year the average rose by just £2,507, or 0.7%, from £356,051 in September 2025. A year earlier the annual rise was 4.6%.
The figures come from HM Land Registry’s UK House Price Index for Central Bedfordshire, published on Wednesday.
Two things to keep in mind. The index covers the whole of Central Bedfordshire, from Leighton Buzzard and Linslade in the west to Potton and Sandy in the east. And it is a mean average, not a median, so a handful of large sales pull it up. The town’s own medians are on our Leighton Buzzard house prices page.
Semis up, flats down
The split by property type shows where the small rise came from.
In the year to September 2026:
- semi-detached: £379,950, up £6,004 (1.6%)
- terraced: £301,471, up £2,919 (1.0%)
- detached: £612,275, up £2,661 (0.4%)
- flats and maisonettes: £173,982, down £3,311 (1.9%)
Semi-detached homes did best. Flats are the only type worth less than a year ago.
The average first-time buyer paid £302,401, up £2,698 (0.9%). The average home mover paid £429,131, up 0.6%.
Buyers with a mortgage paid £359,123 on average and cash buyers £356,630. The gap between them is under £2,500.
Two years of prices
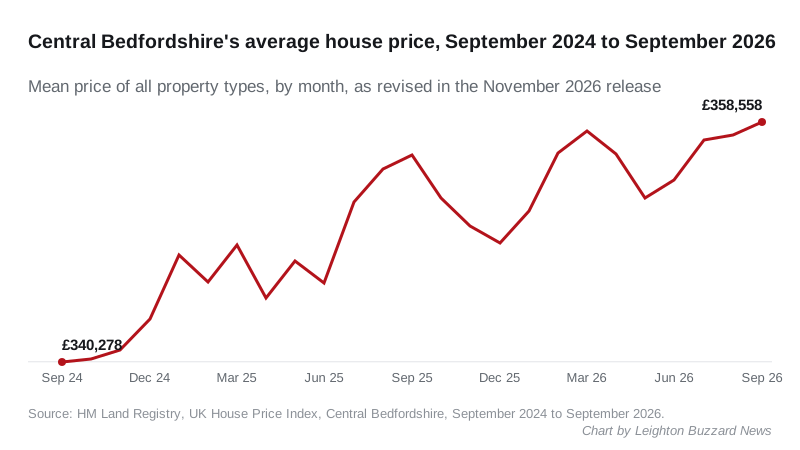
Two years ago, in September 2024, the district average was £340,278. Prices have since risen by £18,280, but not in a straight line. They fell over the winter of 2025, from £356,051 in September 2025 to £349,299 in December, and dipped again in May 2026 to £352,759.
August and the rest of the year have been revised
The index revises recent months as late sales are registered at the Land Registry. This month’s revisions were large.
When we reported August’s figures in October, the average was £355,263, up 0.1%, with detached homes down 0.7% on the year. The index now puts August at £357,579, up 0.7%, with detached homes up 0.4%. We have added a correction to that story.
Earlier months have moved too. March 2026, which we reported as a record £359,268, is now £357,884. That is why September counts as the new high.
How the district compares
| Area | Average price | Annual change |
|---|---|---|
| Buckinghamshire | £471,667 | −1.4% |
| Hertfordshire | £471,660 | +1.6% |
| Central Bedfordshire | £358,558 | +0.7% |
| East of England | £338,357 | +0.7% |
| Bedford | £331,113 | +1.2% |
| Milton Keynes | £326,491 | +2.1% |
| England | £292,998 | +0.8% |
| Luton | £282,806 | −1.1% |
Central Bedfordshire is growing at the same rate as the East of England (0.7%) and just behind England (0.8%).
The sharpest contrast is just over the county border. Buckinghamshire, which begins just west of Linslade, fell 1.4%, and its average is now level with Hertfordshire’s. Milton Keynes, to the north-west, rose 2.1%, the fastest of any area around the district. Luton, to the east of Dunstable, fell 1.1%.
What it means for you
- If you are selling a semi, yours is the type that has gained most: about £6,000 on the district average in a year.
- If you own a flat, the average is still down £3,311 on the year.
- If you are buying a first home, the typical first-time purchase has risen £2,698 in a year, to just over £302,000.
- If you are checking a valuation, the district mean says little about one street. The Land Registry’s price paid service shows what homes near you actually sold for.
The index for October 2026 is due in HM Land Registry’s next release in December.
Sources
- HM Land Registry, UK House Price Index for Central Bedfordshire, September 2026 and earlier months as revised in the November 2026 release, read from the index’s linked data service.
- The same index for Bedford, Milton Keynes, Luton, Buckinghamshire, Hertfordshire, the East of England and England.
Have your say