
The average Central Bedfordshire home was £355,263 in August, up just 0.1% in a year: the weakest growth since July 2024. Detached homes and flats both fell.
The average home in Central Bedfordshire was worth £355,263 in August 2026. That is £319 more than a year earlier, a rise of 0.1%.
The figure comes from the latest UK House Price Index, published by HM Land Registry this week (UK House Price Index, Central Bedfordshire, August 2026).
It is the weakest annual growth the district has recorded since July 2024, when prices were still falling. A year ago, in August 2025, the annual rise was 5.3%.
Prices also slipped on the month. August’s average is £735 below July’s, a fall of 0.2%.
Two things to keep in mind. The index covers the whole of Central Bedfordshire, from Leighton Buzzard and Linslade in the west to Potton and Sandy in the east. And it is a mean average, not a median, so a few large sales pull it up. Our Leighton Buzzard house prices page has the town’s own medians.
Detached homes and flats are now worth less than a year ago
Split by property type, the market has divided down the middle.
In the year to August 2026:
- semi-detached: £376,156, up £3,544 (1.0%)
- terraced: £299,898, up £2,789 (0.9%)
- detached: £603,864, down £4,210 (0.7%)
- flats and maisonettes: £173,335, down £3,982 (2.2%)
The detached figure is the new one. Last month detached homes were still up on the year. In August the average detached home lost £4,871 on July alone, and it is now at its lowest since December 2025.
Flats have been falling all year. At £173,335, the average flat is worth less than it was in August 2025, when it was £177,317.
The average first-time buyer paid £299,948, up £1,220 (0.4%) on a year earlier. That is just under the £300,000 mark it crossed in July.
The slowdown, month by month
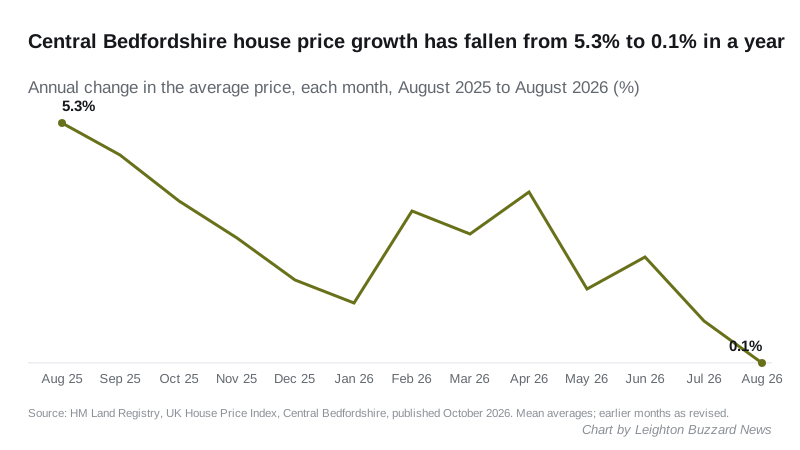
The annual change in the district’s average price, as the index now records it:
| Month | Annual change |
|---|---|
| August 2025 | 5.3% |
| September 2025 | 4.6% |
| October 2025 | 3.6% |
| November 2025 | 2.8% |
| December 2025 | 1.9% |
| January 2026 | 1.4% |
| February 2026 | 3.4% |
| March 2026 | 2.9% |
| April 2026 | 3.8% |
| May 2026 | 1.7% |
| June 2026 | 2.4% |
| July 2026 | 1.0% |
| August 2026 | 0.1% |
The district’s record average is now £359,268, in March 2026. August is £4,005 below it.
The figures for July have been revised
The index revises recent months as late sales are registered. When we reported July’s figures in September, the average was £356,758, up 1.2%. The index now puts July at £355,998, up 1.0%. The March record has been revised up, from £358,420 to £359,268.
How the district compares
Central Bedfordshire is not alone. Growth has almost stopped across the area around it.
| Area | Average price | Annual change |
|---|---|---|
| Buckinghamshire | £477,450 | 0.0% |
| Hertfordshire | £469,651 | +1.4% |
| Central Bedfordshire | £355,263 | +0.1% |
| East of England | £337,848 | +0.2% |
| Bedford | £330,462 | +1.1% |
| Milton Keynes | £323,868 | +0.5% |
| England | £293,525 | +0.4% |
| Luton | £285,800 | +0.1% |
Central Bedfordshire is growing more slowly than England as a whole (0.4%) and the East of England (0.2%). Of its neighbours, only Buckinghamshire, across the county border from Linslade, did worse, with no change at all. Bedford and Hertfordshire are the only nearby areas still rising by more than 1%.
What it means for you
- If you are selling a detached home, the district average is about £4,200 lower than a year ago. Asking prices set on last year’s comparables may be too high.
- If you are buying a first home, the typical first-time purchase has barely moved in a year, up £1,220. The price you were saving for has not run away from you.
- If you own a flat, the average is down £3,982 on the year, the steepest fall of any property type.
- If you are remortgaging, a lender’s valuation is about your home, not the district mean. Check recent sold prices on your own street on the Land Registry’s price paid service.
Figures for September 2026 are due in HM Land Registry’s next release in November.
Sources
- HM Land Registry, UK House Price Index for Central Bedfordshire, August 2026 and earlier months as revised in the October 2026 release, read from the index’s linked data service.
- The same index for Bedford, Milton Keynes, Luton, Buckinghamshire, Hertfordshire, the East of England and England.
Have your say