
5,195 people in Central Bedfordshire claimed unemployment benefits in October, the most since October 2021. Every one of the month's extra claims was made by a woman.
More people are claiming unemployment-related benefits in Central Bedfordshire than at any time in the last five years.
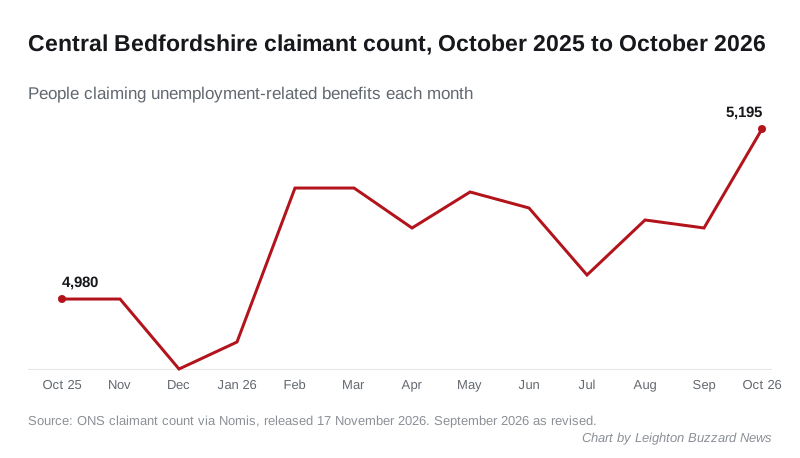
There were 5,195 claimants in October 2026, according to figures the Office for National Statistics released on Tuesday. That is 125 more than in September and 215 more than in October 2025. The last month with a higher count was October 2021, when it stood at 5,335 and was still falling after the pandemic. (ONS claimant count, via Nomis)
Claimants now make up 2.7% of residents aged 16 to 64. The rate had been 2.6% every month since February.
The figures
- October 2026: 5,195 claimants, 2.7% of 16 to 64-year-olds
- September 2026: 5,070, as revised
- October 2025: 4,980
- Low point of the last year: 4,890, in December 2025
September’s figure was revised down
Last month we reported 5,150 claimants for September and called it a four-year high. The ONS has since revised September to 5,070. On the revised figure, September was not a high at all: the count had been 5,120 in February and March.
October’s 5,195 is higher than any of those months, so the rise is now real rather than a first estimate. The September story carries a correction.
Women account for the whole monthly rise
The count for men did not move between September and October. The count for women rose by 125.
| September 2026 | October 2026 | Change | |
|---|---|---|---|
| Men | 2,680 | 2,680 | 0 |
| Women | 2,390 | 2,515 | +125 |
(ONS claimant count by sex, via Nomis)
The figures do not say why. One month’s change can also be revised when the November figures come out.
Under-25s back to their 2021 level
Claims by 16 to 24-year-olds reached 1,100 in October. That matches July 2021 and is the highest count for the age group since then.
| Age | October 2025 | October 2026 | Change |
|---|---|---|---|
| 16 to 24 | 990 | 1,100 | +110 |
| 25 to 49 | 2,850 | 2,870 | +20 |
| 50 and over | 1,140 | 1,225 | +85 |
More than half of the year’s rise came from under-25s. Claims by people aged 25 to 49 barely changed. (ONS claimant count by age, via Nomis)
Dunstable and Leighton Buzzard
The ONS also publishes the count for each parliamentary constituency. The Dunstable and Leighton Buzzard seat had 2,420 claimants in October, 3.3% of its residents aged 16 to 64. That is up 45 on a revised September figure of 2,375, and up 105 on October 2025. It is the seat’s highest count since August 2021.
The rate is well above the district’s 2.7%. The figures do not separate Leighton Buzzard from Dunstable and Houghton Regis. (ONS claimant count, Dunstable and Leighton Buzzard, via Nomis)
Still among the lowest rates in the region
Central Bedfordshire’s 2.7% is still the second-lowest of the 11 county and unitary areas in the East of England. Only Cambridgeshire, at 2.4%, is lower.
| Area | Claimants as % of 16 to 64s, October 2026 |
|---|---|
| Cambridgeshire | 2.4% |
| Central Bedfordshire | 2.7% |
| Suffolk | 2.9% |
| Hertfordshire | 3.0% |
| Bedford | 4.4% |
| Luton | 6.6% |
| East of England | 3.3% |
| England | 4.1% |
(ONS claimant count, East of England areas, via Nomis)
What the claimant count measures
The claimant count is not the unemployment rate. It counts people claiming Jobseeker’s Allowance, or Universal Credit with a requirement to look for work. It also includes some people in work on low earnings who must look for more hours.
The ONS labels local authority claimant figures as official statistics in development. All counts are rounded to the nearest five. The latest month is often revised when the next figures come out, as September’s was.
What it means for you
- If you are out of work or on low hours, you may be able to claim Universal Credit. The government’s benefits calculator page lists free, independent calculators that show what you could get.
- If you are under 25, claims in your age group are at their highest since 2021. A work coach at your Jobcentre is the first stop for training and work placements.
- If you are hiring, more people in the district are looking for work than at any point in the last five years.
Have your say