
Land Registry has revised June down: the Central Bedfordshire average is now £354,690, £1,763 less than first published, and the annual rise 2.4% not 2.9%.
Correction, 20 September 2026. HM Land Registry has revised the June 2026 figures since this article was published on 19 August. The district average for June is now £354,690, £1,763 lower than the £356,453 reported below, and the annual change for June is now 2.4%, not 2.9%. The June first-time buyer average is now £299,013, which is £1,597 lower and back below £300,000: the statement further down that the figure “crossed £300,000 in February 2026 and has stayed above it every month since” no longer holds for June. The revised breakdown by type for the year to June is semi-detached £375,892 (up 3.5%), terraced £297,519 (up 3.2%), detached £606,700 (up 1.6%) and flats £172,521 (up 0.2%). The district’s April peak has also been revised, from £361,017 to £358,142, which makes March 2026, at £358,420, the district’s record month. The figures as first published are left below, unaltered. The July 2026 index is covered here.
The average home in Central Bedfordshire sold for £356,453 in June 2026, according to figures HM Land Registry published at 9.30 this morning. That is £10,207 more than in June 2025, a rise of 2.9%. (UK House Price Index, Central Bedfordshire, June 2026)
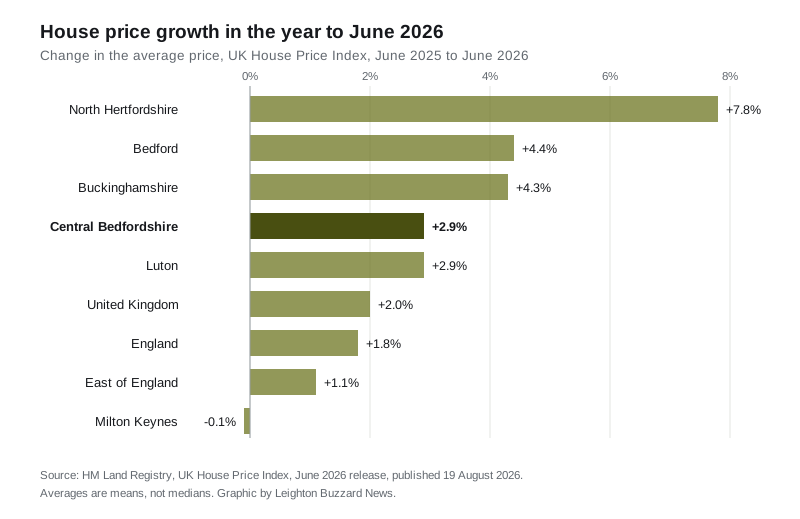
A 2.9% rise is faster than the country the district sits in. Across the East of England the average was £338,707, up 1.1%. Across England it was £293,262, up 1.8%, and across the UK £272,188, up 2.0%. (UK House Price Index, June 2026)
Two things to hold on to before the numbers. The index covers the whole Central Bedfordshire district, which runs from Leighton Buzzard in the west to Potton on the Cambridgeshire border. And the figure is a mean average, not a median: a handful of large sales pull it upwards, so it sits well above what the middle home in any one town changes hands for. Our Leighton Buzzard house prices page sets out the town medians alongside it.
Semis rose fastest, flats barely moved
The index splits the district by property type. In the year to June 2026:
- semi-detached: £377,764, up 4.0%
- terraced: £298,788, up 3.7%
- detached: £609,871, up 2.1%
- flats and maisonettes: £173,703, up 0.9%
The spread matters more than the headline. A semi in Central Bedfordshire gained roughly £14,500 over the year while a flat gained about £1,600. That is the same pattern the district has run for a while: this is a house market, and the flat market has been going nowhere.
Detached homes are the odd entry. They are far and away the most expensive type, at £609,871, but they rose more slowly than either semis or terraces.
First-time buyers are stuck just above £300,000
The average first-time buyer paid £300,610 in June, up 3.4% on a year earlier.
That figure crossed £300,000 in February 2026 and has stayed above it every month since:
- February 2026: £301,366
- March 2026: £303,219
- April 2026: £304,058
- May 2026: £300,567
- June 2026: £300,610
So the first rung has been sitting at roughly the same height for five months, after climbing through the winter. April was the peak, at £304,058.
How the neighbours compare
Annual change in the average price, year to June 2026:
| Area | Average price | Annual change |
|---|---|---|
| North Hertfordshire | £422,616 | +7.8% |
| Bedford | £329,830 | +4.4% |
| Buckinghamshire | £490,508 | +4.3% |
| Central Bedfordshire | £356,453 | +2.9% |
| Luton | £289,790 | +2.9% |
| United Kingdom | £272,188 | +2.0% |
| England | £293,262 | +1.8% |
| East of England | £338,707 | +1.1% |
| Milton Keynes | £325,104 | -0.1% |
Milton Keynes is the one to watch from Leighton Buzzard, because it is the town most people here weigh their money against. Its average is £325,104 and slightly lower than a year ago, the only area in that table going backwards. Central Bedfordshire is now about £31,000 above it.
The month itself was flat
Month to month, the district went nowhere. June’s £356,453 is essentially level with May’s £356,617, a change the index records as 0.0%.
The district’s average peaked at £361,017 in April 2026 and has drifted down by £4,564 in the two months since. Read against a 2.9% annual rise, that says the year’s growth landed in the winter and spring, and the market has been flat since.
What it means for you
If you are selling. The annual number is a good headline and a poor guide to this week. Prices in the district have not moved since April. If you own a semi you are in the part of the market that has done best; if you own a flat, the index says your value is roughly where it was a year ago.
If you are buying your first home. £300,610 is the district-wide average paid by first-time buyers, not the entry price. Plenty sells for well below it, and the flat market, flat as it is, is the part that has not run away.
If you are watching the numbers. These figures will change. The UK HPI is revised as more completed sales are processed, and the most recent months are the least settled: Land Registry suppresses new-build sales counts for the latest two months for exactly that reason. Treat June’s figure as a first estimate. (UK House Price Index reports, HM Land Registry)
The next release. The July 2026 index is published at 9.30am on Wednesday 16 September 2026.
Sources
- UK House Price Index, Central Bedfordshire, June 2026, HM Land Registry, published 19 August 2026
- UK House Price Index reports collection, HM Land Registry, last updated 19 August 2026
Have your say