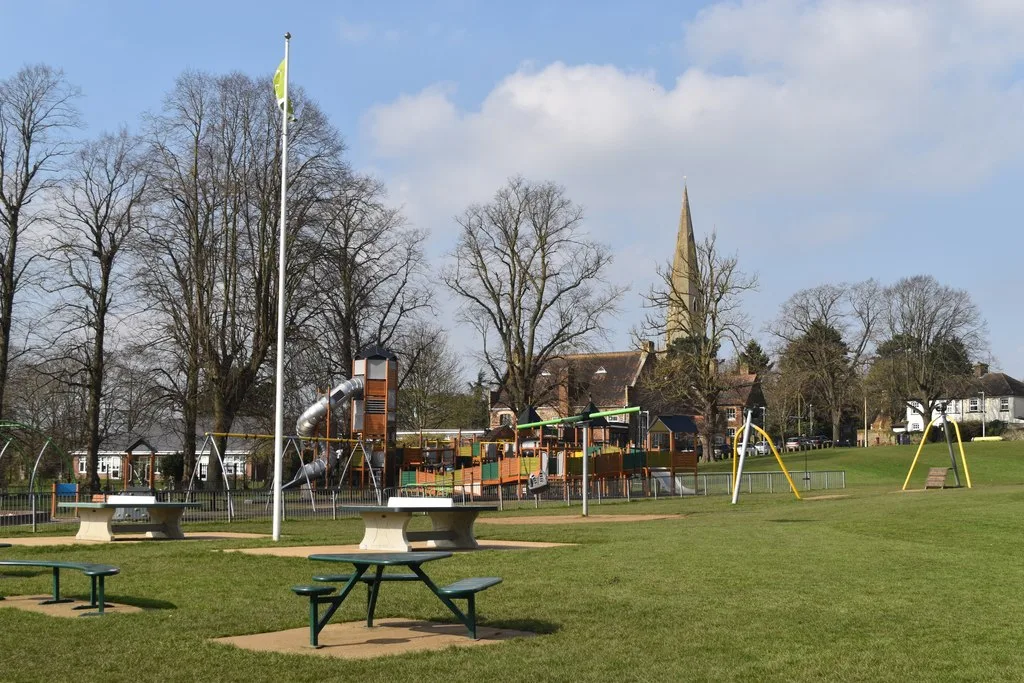

Central Bedfordshire is joint ninth of 153 areas in the Children's Commissioner's Childhood Lottery. Its children in care fare worst in the region on four measures.
Central Bedfordshire is one of the ten places in England where growing up is least challenging, according to the Children’s Commissioner for England.
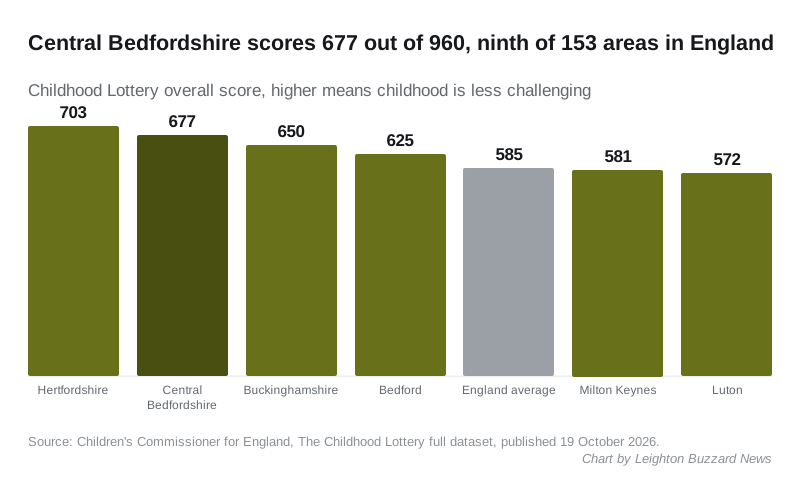
The Commissioner’s new report, The Childhood Lottery, scores every upper-tier council area out of 960. Central Bedfordshire scored 677, placing it joint ninth of 153 with Wokingham. Only Hertfordshire did better in the East of England. The report was published on Monday 19 October. (Children’s Commissioner, The Childhood Lottery)
The same data also shows where children here do worse than almost anywhere else in the region. Most of those measures are about children in care.
What the score is, and what it is not
The score is built from 96 measures of children’s lives, each marked out of 10. They cover:
- education, jobs and skills
- health
- family life
- care
- community safety
- children’s own views of their area and their future
Every measure counts equally. The Commissioner’s full dataset gives each council’s figure, its score and its rank on every one. (Children’s Commissioner, full dataset)
The council stresses that this is not a league table of its own work. “The report is clear that these scores are not a measure of council performance,” it said. They reflect things like child poverty, policing and health services as well. (Central Bedfordshire Council, 19 October 2026)
How we compare with our neighbours
The England average is 585. Cheshire East came top with 730 and Middlesbrough bottom with 408. (The Childhood Lottery report, tables 1 and 2)
| Area | Score out of 960 | Rank of 153 |
|---|---|---|
| Hertfordshire | 703 | 5 |
| Central Bedfordshire | 677 | joint 9 |
| Buckinghamshire | 650 | 25 |
| Bedford | 625 | 43 |
| Milton Keynes | 581 | 82 |
| Luton | 572 | 92 |
Where Central Bedfordshire does best
Several of its best results are about young people leaving care, which makes the weaker care figures below all the more striking.
- Care leavers in suitable homes: 97.7% of 17 to 21-year-olds, against 89% in England. That is third best in the country and the best in the East of England.
- Care leavers not in work, education or training: 23%, against 40% in England. Fifth best nationally, and the lowest in the region.
- Wraparound childcare: 77.3% of schools told the Commissioner in summer 2024 that they offered it, against 63% in England. Seventh best.
- Feeling safe: 7.5% of children surveyed disagreed that they felt safe in their local area, against 12.3% in England.
- Year 6 weight: 31.1% of 10 and 11-year-olds were overweight or obese in 2024/25, against 36.1% in England.
Where it lags
Four measures put Central Bedfordshire at the bottom of the 11 councils in the East of England. All come from Department for Education or health data.
- Social worker changes. 39.2% of children in care had three or more social workers during 2024-25. The England figure is 24%. That ranks 140th of 153.
- Placements outside the area. 66.8% of children in care were living outside Central Bedfordshire in 2025, against 49.2% in England. Ranked 134th.
- Mental health admissions. There were 16 inpatient hospital admissions for mental health per 10,000 children, double the England rate of 8. Ranked 144th.
- GCSE results for children in care. Their average Attainment 8 score was 12.3 out of 90, against 17.3 in England. Ranked 138th.
School results overall sit in the middle of the table. The average Attainment 8 score for all pupils was 44.2, against 46 in England, ranked 105th.
Two school measures come from the Commissioner’s own survey of schools in summer 2024. In Central Bedfordshire, 80.5% of schools said they offered breakfast, against 94% in England. And 32.8% said they offered free food, against 41%. Those are the schools’ own answers, not a count of provision.
What the council said
Cllr Mackey, the council’s executive member for children and families, said the result was “down to far more than the council”. Schools, health services, the police, the voluntary sector and families themselves “all play a part”.
“We also know that averages can hide differences within an area, and that not every child or family here has the same experience,” Cllr Mackey said.
What it means for you
The ranking is a county-wide average. It does not tell you about a particular school, street or estate in Leighton Buzzard or Linslade.
- If you are choosing a school, look at that school’s own Ofsted report and results rather than the county average.
- If you have thought about fostering, the placement figure is the one to note: two in three children in Central Bedfordshire’s care live outside the area.
- If you want to see every measure, the Commissioner’s full dataset lists all 128 figures for Central Bedfordshire, with the England average beside each.
For more on the area’s support for children with special educational needs, see our report on the EHCP backlog.
Have your say